

Z-Scores in Python
Exploring a statistical technique for comparing percentages

So, your child gets 78% in both physics and history. Both pretty good grades but as the reader of geeky blogs like this you believe the sciences are more important than the humanities and would have preferred your child to do better in physics than history.
However, we are not necessarily comparing like with like here: 78% in one subject is probably not equivalent to 78% in another. Rather than the absolute percentages we need to calculate and compare the Z-Scores which take into account the averages and ranges of the entire set of scores.
The Z-Score equivalents of percentage scores measure the difference between the mean percentage and the individual scores in units of standard deviation. (The standard deviation can be thought of as a measure of how much, on average, the individual scores vary from the mean.)
As an example, if the mean is 60 and the standard deviation is 10, the Z-Scores of 50%, 60% and 70% would be -1, 0 and 1 respectively.
The formula for calculating Z-Scores is as follows, where μ is the arithmetic mean (the "average" in everyday usage) and σ is the standard deviation.
Z = (x - μ) / σ
For this project I will use two sets of fictitious grades with means and standard deviations of:
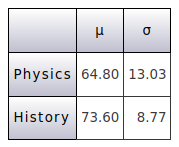
We can see that the average physics score is a lot lower than the average history score so 78% in physics is already looking a lot better than the same percentage in history. Let's calculate the Z-Scores of 78% for each subject using the formula above.
Z-Scores of 78% in Physics
Z = (78 - 64.8) / 13.03 = 1.01
Z-Scores of 78% in History
Z = (78 - 73.6) / 8.77 = 0.5
So your kid is half a standard deviation above average in history but more than a whole standard deviation above average in physics. Yippee!
Coding
In this project I will write a simple function which takes a list of numbers and returns a dictionary containing the following:
The arithmetic mean of the data
The standard deviation of the number
A list of dictionaries containing the original data values and their equivalent Z-Scores
I'll also write a few lines of code to test the above function and print the results.
The project consists of the following two files which you can clone/download the Github repository.
zscores.py
zscores_test.py
Let's look at zscores.py first.
zscores.py
import statistics


def calculate(data):

    """
    Returns a dictionary containing:
    The arithmetic mean of the data
    The population standard deviation of the data
    A list of dictionaries containing each data value
    and its corresponding Z-Score.
    """

    arithmetic_mean = statistics.mean(data)
    standard_deviation_population = statistics.pstdev(data)

    zscores = []

    for item in data:
        zscore = (item - arithmetic_mean) / standard_deviation_population
        zscores.append({"Value": item, "Z-Score": zscore})

    result = {"arithmetic_mean": arithmetic_mean,
              "standard_deviation_population": standard_deviation_population,
              "zscores": zscores}

    return result
Firstly we import statistics for its mean and pstdev functions. (You can of course use from statistics import mean, pstdev and just use the function names without the statistics. prefix, but my personal preference is to do it the way shown in the code.)
Next we set a couple of variables with the mean and standard deviation of the data, and create an empty list.
Then we iterate the data, calculating the Z-Score and then adding a dictionary containing the original value and its Z-Score to the list. You could combine the two lines but that would end up a long and messy bit of code.
Finally we combine the mean, standard deviation and Z-Scores list into a dictionary and return it. That's zscores.py finished so let's move on to zscores_test.py.
zscores_test.py
import zscores


def main():

    print("-----------------")
    print("| codedrome.com |")
    print("| Z-Scores      |")
    print("-----------------\n")

    physics_results = [38,40,43,43,49,54,55,57,61,62,62,63,64,64,65,66,66,67,68,68,69,75,76,78,78,79,80,82,85,87]
    history_results = [53,55,58,58,64,68,69,69,69,70,70,72,76,76,77,77,77,77,78,79,79,79,79,80,80,81,81,83,86,88]

    physics_zscores = zscores.calculate(physics_results)
    history_zscores = zscores.calculate(history_results)

    print_zscores("Physics", physics_zscores)
    print_zscores("History", history_zscores)


def print_zscores(subject, zscores):

    """
    Print the mean, standard deviation and z-scores
    in the zscores dictionary in a grid format.
    """

    width = 28

    print("-" * width)
    print("| {:^24} |".format(subject))
    print("-" * width)
    print("| Mean        {:>12.2f} |".format(zscores["arithmetic_mean"]))
    print("| Std.Dev.    {:>12.2f} |".format(zscores["standard_deviation_population"]))
    print("-" * width)
    print("|   Scores   |  Z-Scores   |")
    print("-" * width)

    for item in zscores["zscores"]:
        print("|{:>12.2f}| {:>12.2f}|".format(item["Value"], item["Z-Score"]))

    print("-" * width)


main()
After importing the zscores module we enter the main function, hard-coding a couple of sets of scores and then throwing them at zscores.calculate before finally printing the results with the print_zscores function.
The print_zscores function is a bit fiddly but quite straightforward, printing out the results of zscores.calculate in a table. Now let's run the program with:
python3.7 zscores_test.py
The output is:
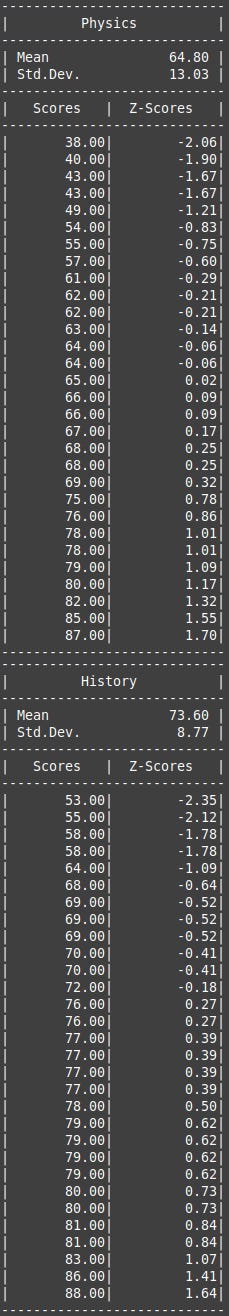
You might like to hunt down the Z-Scores for 78% in both the physics and history sections, and note that they are as calculated in the examples as the beginning of this article.