

Exploring Binocular Lens Sizes with Python


I recently bought a new pair of binoculars (not the ones in the photo above!) which got me thinking about the way binocular magnifications and lens sizes are specified. These are the key characteristics of a pair of binoculars and are specified in the format [magnification]✕[objective lens diameter in millimetres], for example 8✕30 or 10✕42.
The diameter and therefore area of the objective lenses (those at the very front) govern the amount of light the binoculars capture and therefore the brightness of the image, but the area does not increase in direct proportion to the diameter. This is illustrated by the diagram below.
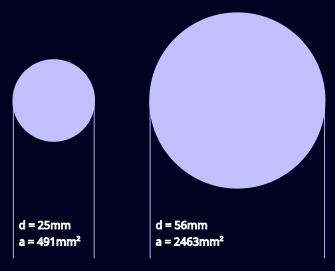
The two lenses shown have diameters of 25mm and 56mm, the smallest and largest sizes of widely available general purpose binoculars. Even though the larger lens has a diameter just over twice that of the smaller lens the 56mm has an area and therefore light-gathering power about five times larger.
In this article I will write some Python code to calculate the areas of a range of lens diameters, displaying them as a bar graph and a table.
Some Simple Arithmetic
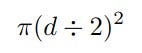
You probably know that the area of a circle is calculated like this, where π is the constant 3.141592653589793 (15dp) and r is the circle’s radius.

Let's modify the formula slightly to allow for the fact that we are working with diameters so need to divide them by 2 to get the radius.
Now let's use the formula with a couple of actual values, 30mm and 40mm, which seem to be the most popular binocular sizes.
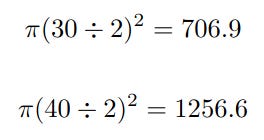
As you can see a relatively modest increase in diameter of one third results in an increase in area approaching double.
This isn’t intended to be a binocular buying guide but basically there is always going to be a compromise between performance on the one hand and price/size/weight on the other. Also note that size and weight are not proportional to lens diameter - as a rule of thumb they are more closely proportional to the magnification.
As a final piece of arithmetic I’ll calculate the relative light gathering capabilities of the 30mm and 40mm lenses used in the examples above.
Here we see that the larger lens has 1.78 times the area of the smaller, and the smaller has 0.56 times the area of the larger. This is basically the same information looked at in two ways.
The Project
This project consists of a single file called binocularlenses.py which you can find in the GitHub repository.
The purpose of the code is to take a selection of common binocular objective lens diameters and calculate the actual areas as well as the areas relative to the smallest.
The code uses some simple functionality from the NumPy and Matplotlib libraries. If you are not familiar with these you might like to read my introductory articles.
The Code
This is the entire binocularlenses.py file.
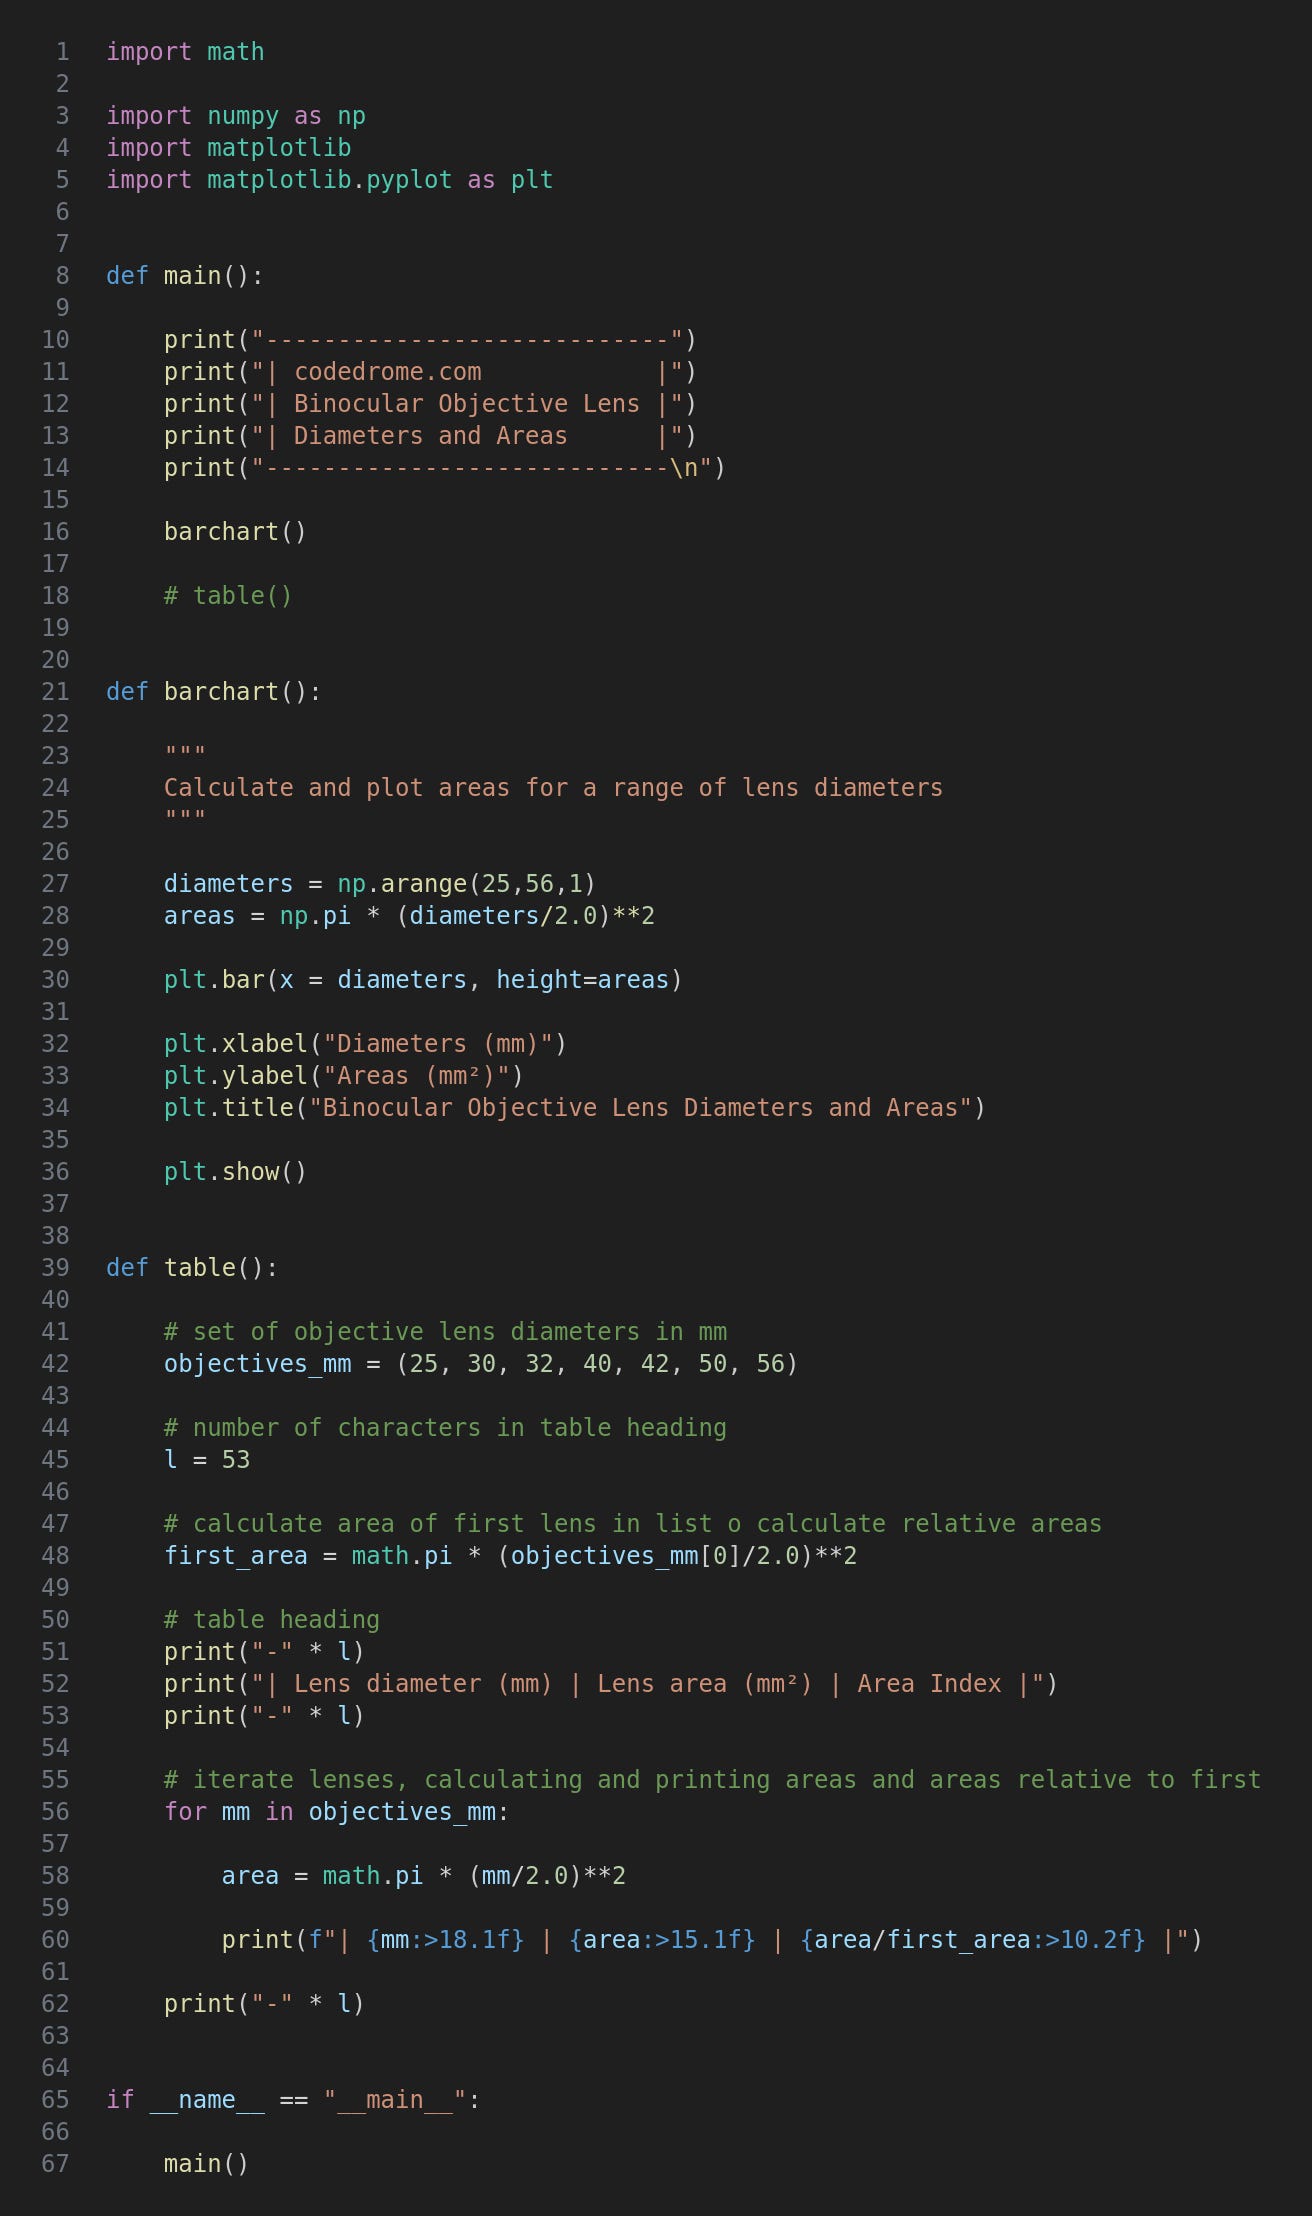
After the imports the main function calls the two functions; you can comment/uncomment these to run the ones you want.
The barchart function creates a NumPy array of values representing a range of lens diameters. (This consists of all the integers in the range, most of which aren’t typically used for binoculars.) This is used to create a second NumPy array of areas; note that we can carry out a calculation on an array in one line of code without any explicit iteration.
These two array are used as arguments to a call to the Matplotlib bar method, a few cosmetic properties are set and the show method is called.
If you run the program with this command...
python3 binocularlenses.py
... you will see the following bar chart.
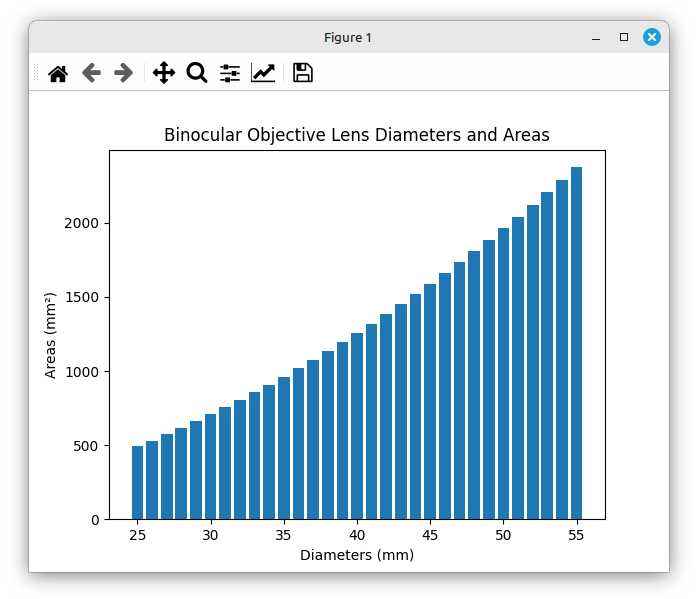
The important thing to note is that the lens diameter roughly doubles but the area increases about fivefold, exactly as shown in the diagram at the beginning of this article.
The table function creates a tuple of lens diameters actually used in binoculars, and then calculates the area of the first; you’ll see why in a moment.
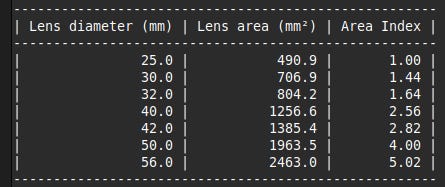
The tuple is then iterated, calculating the area of each current lens. In the print statement we output the diameter and area, and then the area relative to the smallest lens which forms an index baseline value of 1. This forms a handy at-a-glance impression of the relative areas. (If you want to edit the values in the tuple note that they must be in ascending order for this code to work.)
In main comment out barchart(), uncomment table() and run the code again. This is the end result.
For updates and random ramblings please follow me on Bluesky.
No AI was used in creating the code, text or images in this article.