

Exploring Geometry with Python Part 1

I suspect that even those who hated school mathematics lessons could get by in geometry. Not only is everything presented to you in easy to understand lines and shapes but it also has obvious practical uses in designing everything from buildings to computer games.
This article is the first in a series in which I'll implement school-level geometry1 in Python and Matplotlib. As with every other subject what they teach at school is only the tip of the iceberg, and as a longer-term goal I'll extend the project to a more advanced level.
To start with in this article we'll write code to draw (straight) lines, triangles, circles and arcs (sections of circles). This is a fairly modest goal but these simple objects represent what you can draw with a ruler2 and a compass3 and can be used in many ways across the whole of geometry. In fact much of what is in this series is an exact analog of using paper, a pencil and simple geometric instruments.
1 I'm not following any specific school curriculum but will implement the sort of material covered in UK GCSE mathematics, ie to the level of exams taken by 16 year olds.
2 Or a "rule" as your teacher would insist on calling it!
3 "Pair of compasses."
This project uses the NumPy and Matplotlib libraries. If you are not familiar with these I have written brief introductions to them.
The Project
This project consists of the following files which you can clone or download from the GitHub repository.
geometry1.py
geometry1demo.py
This is the entire geometry1.py file.
from typing import Tuple

import numpy as np
import matplotlib.pyplot as plt


def line(xy1: Tuple, xy2: Tuple, color: str="#000000") -> None:

    '''
    Draws a line between the points with
    coordinates in the xy1 and xy2 tuples.
    '''

    # for Matplotlib we need the x and y
    # coordinates as separate tuples
    x = (xy1[0], xy2[0])
    y = (xy1[1], xy2[1])

    plt.plot(x,
             y,
             linewidth=0.5,
             color=color)


def triangle(xy1: Tuple, xy2: Tuple, xy3: Tuple, color: str="#000000") -> None:

    '''
    Draw a triangle with corners at the
    coordinates in the 3 xy tuples.
    '''

    # This is a slicker way of drawing a circle
    # but calling the line function is more
    # in accord with the manual process of
    # drawing a circle with pencil and paper.
    # x = [xy1[0], xy2[0], xy3[0], xy1[0]]
    # y = [xy1[1], xy2[1], xy3[1], xy1[1]]

    # plt.plot(x,
    #          y,
    #          linewidth=0.5,
    #          color=color)

    line(xy1, xy2, color)
    line(xy2, xy3, color)
    line(xy3, xy1, color)


def arc(centre:Tuple, radius:float, start_deg:float, sweep_deg:float, color: str="#000000") -> None:

    '''
    Draws a section of a circle with specified centre and radius.
    start_deg is from the 3 o'clock position and sweep
    is measured anti-clockwise.
    This function can be used to draw a circle with a sweep_deg
    argument of 360.
    '''

    # the sweep is more convenient for
    # calling code but to draw an arc
    # we need the ending angle
    end_deg = start_deg + sweep_deg

    # the trigonometric functions have radian
    # arguments so are converted here.
    start_rad = np.radians(start_deg)
    end_rad = np.radians(end_deg)

    # an array of radians between required angles
    # with a 0.1rad interval.
    # (Might need to descrease the interval for larger radii.)
    radians = np.arange(start_rad, end_rad + 0.1, 0.1)

    # These calculations use the radians Numpy array
    # and so return new Numpy arrays, with the loops
    # abstracted away.
    # The brackets round the first terms aren't
    # necessary but make things a bit clearer.
    x = (np.cos(radians) * radius) + centre[0]
    y = (np.sin(radians) * radius) + centre[1]

    plt.plot(x,
             y,
             linewidth=0.5,
             color=color)


def circle(centre:Tuple, radius:float, color: str="#000000") -> None:

    '''
    Draws a circle with specified centre and radius
    '''

    arc(centre, radius, 0, 360, color)


def draw(xlim:Tuple, ylim:Tuple, xticks:Tuple, yticks:Tuple, title:str) -> None:

    '''
    To be called after all required elements have been
    added to finish and show the drawing.
    '''

    plt.xlim(xlim)
    plt.ylim(ylim)
    plt.xticks(range(xticks[0], xticks[1]))
    plt.yticks(range(yticks[0], yticks[1]))
    ax = plt.gca()
    ax.set_aspect("equal")

    plt.title(title)
    plt.grid(color='#C0C0FF')

    plt.show()
After the imports come a series of functions to draw various shapes: line, triangle (which just calls the line function three times), arc and circle (which uses the arc function). Lastly there's a function called draw which sets up and shows the complete geometrical drawing.
Now we can write a bit of code to demo the above functions. This is geometry1demo.py
import geometry1 as g1
def main():
print("-----------------")
print("| codedrome.com |")
print("| Geometry 1 |")
print("-----------------\n")
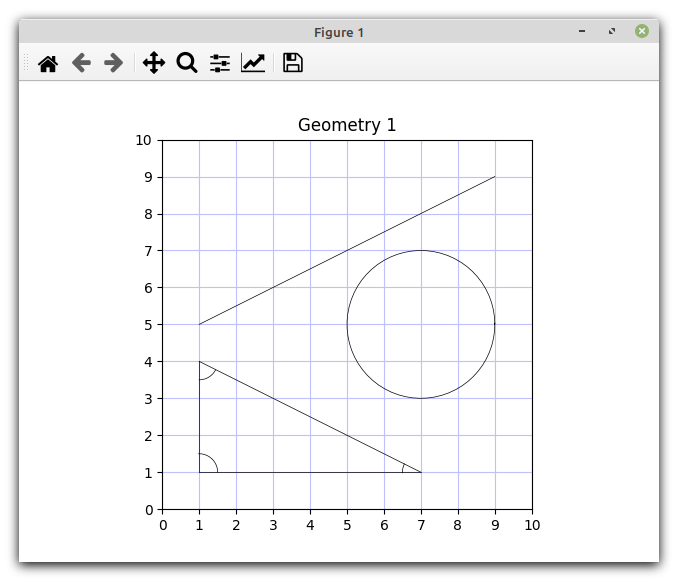
g1.line((1,5), (9,9))
g1.triangle((1,1), (7,1), (1,4))
g1.arc((1,1), 0.5, 0.0, 90.0)
g1.arc((1,4), 0.5, 270.0, 63.0)
g1.arc((7,1), 0.5, 153.0, 26.0)
g1.circle((7.0,5.0), 2.0)
g1.draw((0.0, 10.0), (0.0, 10.0), (0,11), (0,11), "Geometry 1")
if __name__ == "__main__":
main()This is very straightforward, simply importing geometry1 and then calling its functions. Play around with it if you wish but you might need to adjust xlim and ylim in draw to stop any elements running off the edge.
Now run the program with this command.
python3 geometry1demo.py
If you are new to Matplotlib note that you can resize the window in the usual way, and there is a toolbar for zooming in, saving etc.
What's Next?
This is very much the first step in our geometry journey with Python. Remember that the lines and circles/arcs we have drawn so far are no more than virtual representations of the shapes you can draw on paper using a ruler and compass. In future articles I'll take the ruler/compass analogy further by describing how to construct various shapes and angles.