

Polar Plots in Python Part 2: Matplotlib


In Part 1 of this series I showed how to create polar plots using Turtle graphics. For this article I'll replicate the functionality using Matplotlib.
Polar Plots
This section is copied from Part 1 so you might like to skip to The Project section if you have read the previous article.
You are probably familiar with plotting functions on a Cartesian Plane, where for every point on the horizontal x-axis you can calculate a corresponding coordinate on the y-axis using a function of the form:
y = f(x)
For example if you plot
y = x2
you will get something like this.

The above was drawn by iterating x from -10 to 10, and for each value of x calculating the corresponding value of y. Each point x,y is then plotted on the graph.
A polar plot works in a very different way, and plots functions in the form
r = f(θ)
where r is the radius, or distance from the origin at 0,0, and θ is the angle. (θ is the Greek letter theta, generally used to denote an angle.)
To draw a polar plot we therefore need to iterate between two angles (for example 0° to 360°) and calculate the corresponding value of r for each angle. We then plot the point at the current angle from the origin 0,0, at the current distance r from that origin.
The Project
This project consists of three Python files . . .
polarplotsmpl.py
functions.py
polarplotsmpldemo.py
. . . which you can clone or download from the Github repository. This is the same repository as the Turtle-based project.
You'll need Matplotlib for this project. If you don't have it already you can easily pip it. This is the PyPi link:
https://pypi.org/project/matplotlib/
This is polarplotsmpl.py which does the hard work of actually creating polar plots.
polarplotsmpl.py
import math

import matplotlib
import matplotlib.pyplot as plt


def plot(title: str, radius: float, start_degrees: int, end_degrees: int,
         function, color: str):

    # these are for the x and y coordinates
    x = []
    y = []

    # iterate range,
    # calculate x and y,
    # and add them to lists
    for degrees in range(start_degrees, end_degrees + 1):

        radians = math.radians(degrees)

        pos = function(radians, radius)

        x.append(pos["x"])
        y.append(pos["y"])

    # standard Matplotlib stuff to plot values
    plt.plot(x,
             y,
             linestyle="-",
             linewidth=0.5,
             color=color)

    plt.title(title)
    plt.grid(True)
    plt.gca().set_aspect('equal')

    plt.show()
This module contains a single function, plot, with the following arguments:
title: the text shown at the top of the plot
radius: a scaling factor to expand or contract the values and therefore the plot
start_degrees and end_degrees: the range of angles plotted, 0 being the 3 o'clock position. The range can extend outside of the 0° to 360° range, calculated values outside this range not necessarily being the same as the 0° to 360° equivalents.
function: a function to call to calculate values. Samples are shown in functions.py
color: a string in the hexadecimal format "#RRGGBB", eg "#FF8000" is orange.
First up we create a couple of lists for the x and y coordinates, and then iterate the specified range of angles. Within this loop a radian equivalent of the angle in degrees is calculated as this is needed by math functions. The specified function is called, and finally the coordinates appended to their lists.
The rest is very simple and straightforward Matplotlib code which is largely self-explanatory even if you're not familiar with Matplotlib. The call to plot passes iterables of x and y values, the other arguments being cosmetic and specifying the style ("-" is a solid line), width and color of the line.
The next two lines set the title and turn on gridlines, and the following line forces the plot to be square irrespective of values being plotted. Finally the show method displays the plot.
The functions.py file just contains a few Python functions implementing mathematical function which can be used to create polar plots.
functions.py
import math
from typing import Dict


def circle(radians: float, radius: float) -> Dict:

    return {"x": math.cos(radians) * radius,
            "y": math.sin(radians) * radius}


def cardioid(radians: float, radius: float) -> Dict:

    distance = (1 + math.cos(radians)) * radius

    return {"x": math.cos(radians) * distance,
            "y": math.sin(radians) * distance}


def spiral(radians: float, radius: float) -> Dict:

    """
    a - the rotation of the spiral
    b - distance between lines
    """

    a = 1
    b = 3

    distance = a + b * radians

    return {"x": math.cos(radians) * distance,
            "y": math.sin(radians) * distance}


def rose(radians: float, radius: float) -> Dict:

    n = 6

    distance = math.sin(radians * n) * radius

    return {"x": math.cos(radians) * distance,
            "y": math.sin(radians) * distance}
These functions are intended to be called repeatedly in a loop, and therefore tale a angle and a radius, and then return the corresponding x and y coordinates in a dictionary. As mentioned above the radius is a scaling factor applied to unit values.
Trying it Out
Lastly we just need a simple bit of code to try it all out.
polarplotsmpldemo.py
import polarplotsmpl as ppm
import functions


def main():

    print("--------------------")
    print("| codedrome.com    |")
    print("| Polar Plots with |")
    print("| Matplotlib       |")
    print("--------------------\n")

    ppm.plot("circle", 120, 0, 360, functions.circle, "#008000")
    # ppm.plot("cardioid", 75, 0, 360, functions.cardioid, "#000080")
    # ppm.plot("spiral", 100, 0, 2880, functions.spiral, "#FF8000")
    # ppm.plot("rose", 150, 0, 360, functions.rose, "#FF0080")


if __name__ == "__main__":

    main()
This file imports the two modules from above, and then calls plot with each function in turn. You can just comment/uncomment the individual lines to run the one you want.
You can run the code with this command.
python3 polarplotsmpldemo.py
The plots of each of the four functions are shown below.

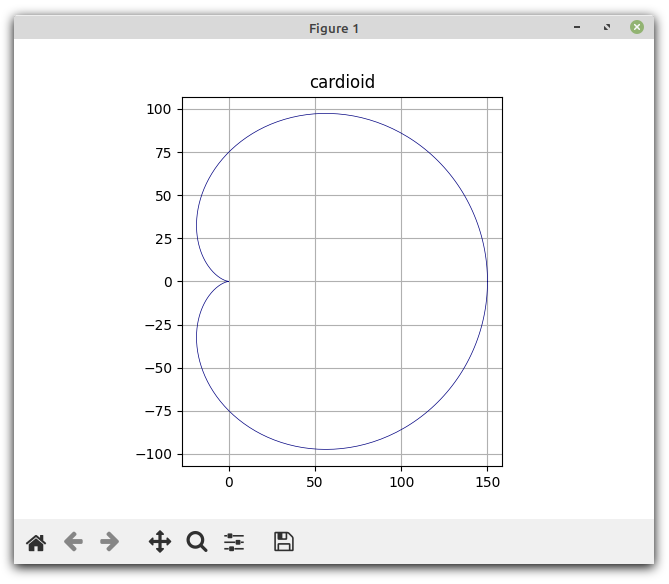


You can resize the window in the usual way by dragging the border, and you might like to mess around with the buttons. Notice that there's a save button which saves the plot as a PNG.
These are only a few samples, each of which can be varied by editing the hard-coded parameters. There are also many more possible polar-plottable functions, an infinite number in fact. If you know of or can dream up any more please let me know.