

Tickertape Gravity Experiment in Python


You may remember doing the tickertape experiment at school to measure the acceleration of an object falling under Earth's gravity. For this project I'll simulate the experiment using Python and then carry out a few calculations with the resulting data.
The Tickertape Experiment
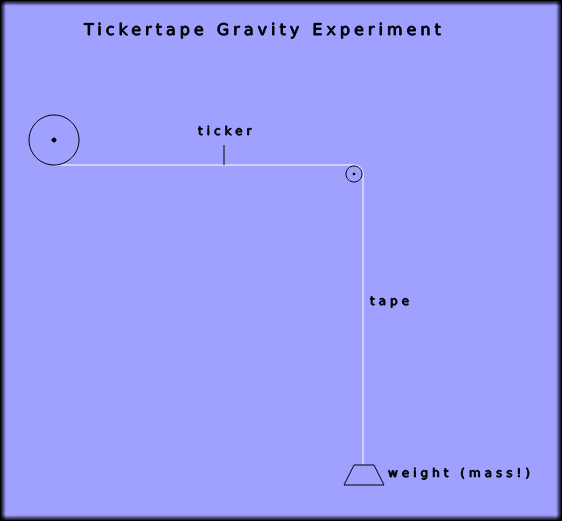
The graphic below is a schematic representation of the tickertape gravity experiment. A roll of paper tape is pulled by the weight - or mass as your physics teacher insisted on calling it - under a ticker which marks a dot on the tape at fixed intervals. As the mass is accelerating due to gravity the tape moves a bit further between each consecutive dot. By measuring the distances it is possible to calculate the acceleration due to gravity, a value known by convention as g.
In this article I will code a simulation of the tickertape experiment and use the results to calculate g. Of course to program the simulation we need to know g beforehand so we'll be calculating something we already know. Welcome to the World of Make-Believe! I will also create an actual tickertape representation using Matplotlib.
The simulation takes a few liberties with what would be practical or realistic in the real world. Firstly I have ignored both friction in the pulleys and air resistance on the mass. Hopefully in a well set up experiment these would be minimal. More spectacularly my virtual experiment runs for 16 seconds which would need a drop of over 1250m, one and a half times the height of the Burj Khalifa. In practice the mass would reach terminal velocity part-way through the drop so the speed and displacement would be less than the theoretical values from our simulation.
A real-world experiment would be carried out with a drop of perhaps 1m and the ticker printing a dot many times per second.
Kinematics
The quantities measured in this experiment and the related calculations form part of a field of applied mathematics known as kinematics, derived from the Greek for movement. There are five key quantities involved which can be remembered with the acronym suvat. These are described in the table below.
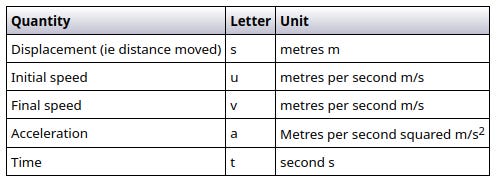
In general, if you know any two or three quantities you can calculate the others. For this project I will be implementing three kinematics formulas.
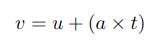
Calculating Final Speed from Acceleration and Time
As part of the simulation we'll calculate the speed at which the mass and tape are moving at each interval or each tick of the ticker. For this we need to know the acceleration and time. (As I mentioned the simulation needs to know the acceleration, the quantity the real-life experiment is designed to find out.) The formula below shows how to do this and also allows for any initial speed u, although this is superfluous here as I'm assuming the experiment starts from stationary.

(If you research kinematics further you may find formulas in a more concise form than the ones I have shown here. I have expanded them with, for example, multiplication signs instead of implicit multiplication to make them more closely resemble the Python-coded versions.)
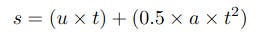
Calculating Displacement from Initial Speed, Time and Acceleration
This is also part of the simulation and is used to calculate the distances moved during each interval. Again the initial speed u is included but set to 0 in the code.
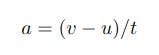
Calculating Acceleration from Final Speed, Initial Speed and Time
After the simulation has run we'll feed the last values of v and t into the following equation to calculate the acceleration a which in this context is the Earth's gravity g. Remember though that kinematics is general purpose and the equations could also be used to calculate, for example, a car journey. As you know by now the Python simulation assumes u = 0.
The Project
This project consists of a single file called tickertapeexperiment.py which you can clone or download from the GitHub repository.
The code uses the NumPy and Matplotlib libraries. If you are new to these you might like to read my reference articles to get you up and running with them quickly.
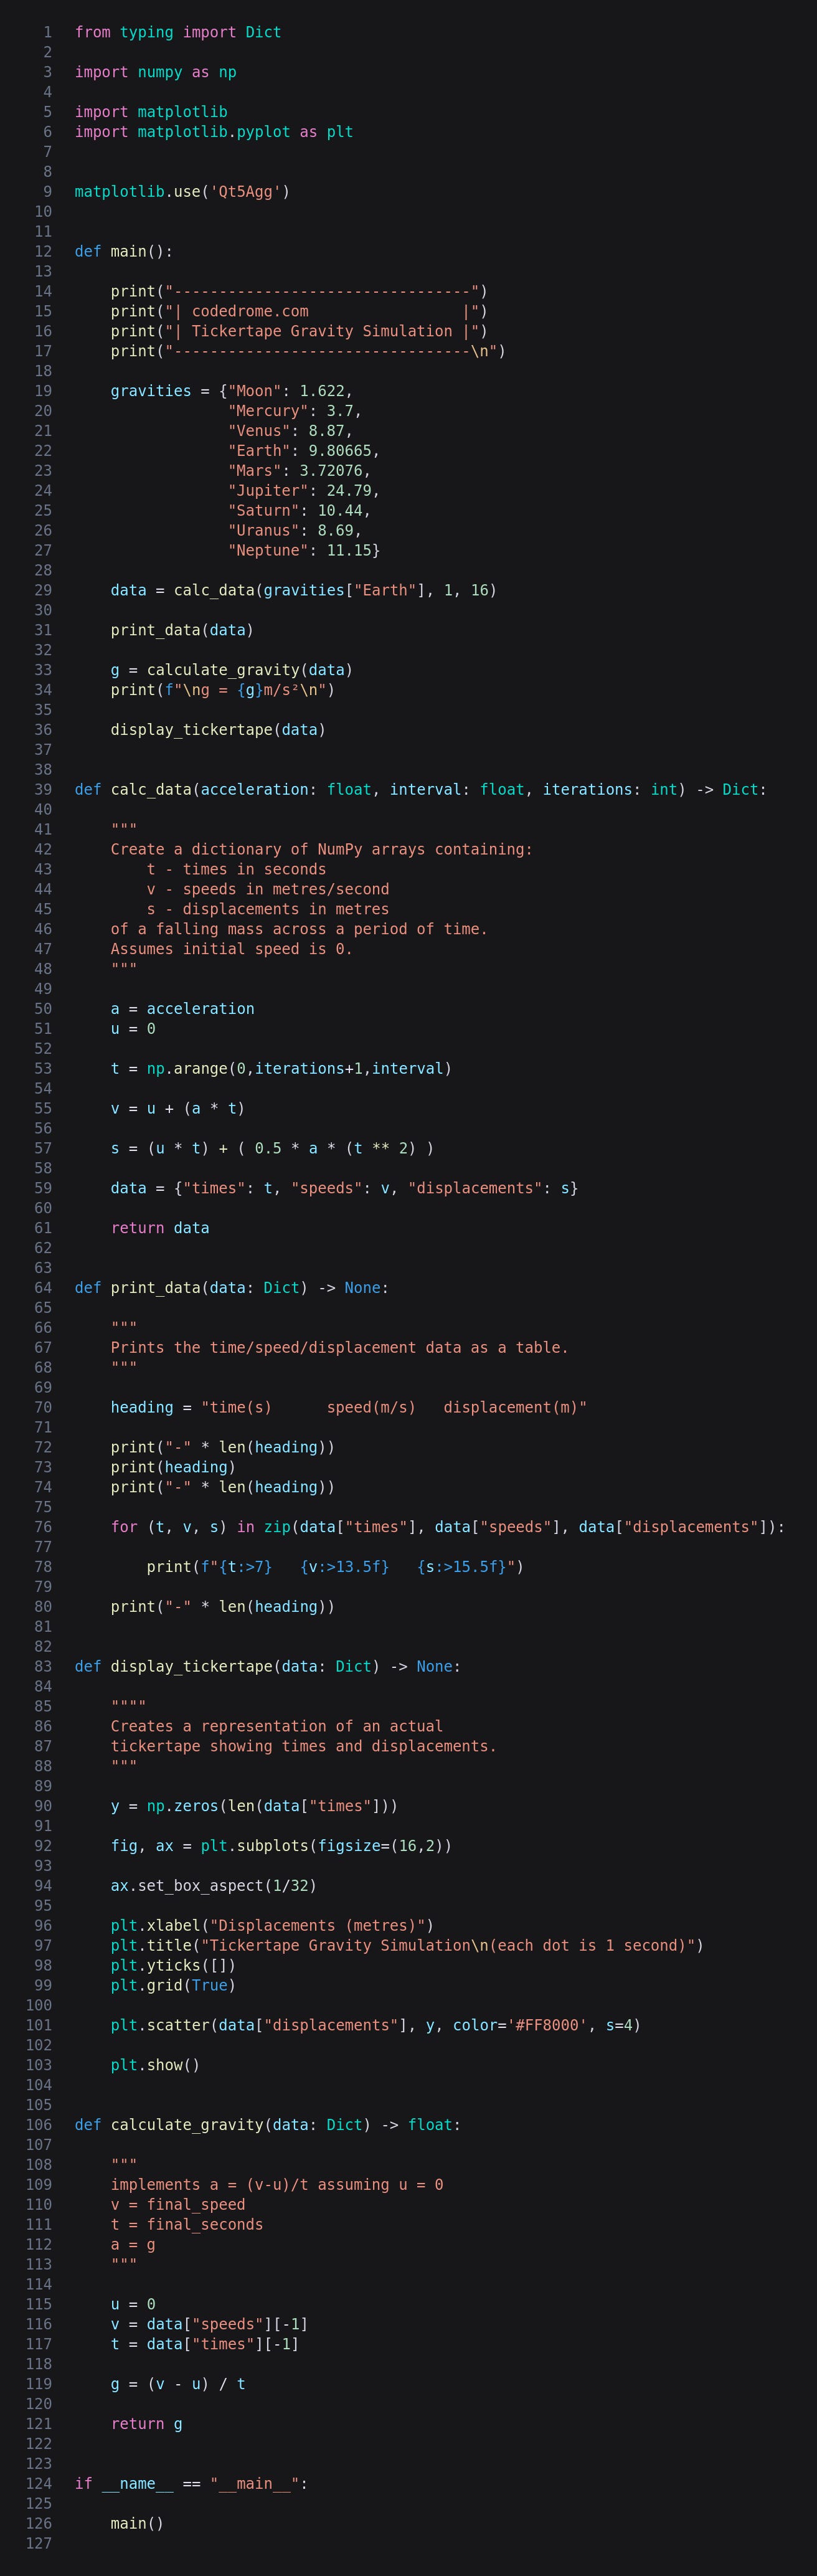
The Code
This is the entire code listing.
The main Function
After a few imports the main function creates a dictionary of gravities for our Moon and the eight planets of the Solar System (sorry Pluto). The rest of main calls the other functions and outputs the value calculated for g. You can change the first argument of calc_data to one of the other dictionary keys if you wish.
calc_data
This function creates a dictionary containing three NumPy array for times (the number of separate times and their intervals as per the arguments) as well as speeds and displacements at each interval.
The times array t is created with the NumPy arange method, and then speeds v is created using the formula discussed above.
As we are using NumPy the calculation can be carried out on the entire array in a single line without a loop. The same applies to the calculation of displacements s in accordance with the formula:

All that is left to do is to assemble the arrays into a dictionary and return it.
print_data
A mundane function which prints a heading before iterating and printing the data.
display_tickertape
Matplotlib is very versatile and can be used for many tasks beyond its core dataviz functionality. To create a representation of a tickertape after having been run through the experimental apparatus I have first created an array of y values all set to zero as the dots are to be printed horizontally. After that a wide but short figure is created; I chose a ratio of 16:2 but this is not critical. Next the axis box aspect is set - note that this is separate from the figure size and ratio and is the central part of the plot which displays the dots.
After a few cosmetic settings we plot the dots with a call to scatter, the x-axis data being displacements and the y-axis being the array of zeros. The third and fourth arguments are the color and size of the dots. As always with Matplotlib we mustn't forget to call show().
calculate_gravity
Finally a short function which implements the formula to work out g from the speeds and time. Initial speed u is hard-coded to 0, while final speed v and time t are set to the last values in data. Then we just code the formula:

and return the result.
Running the Program
Run the program with this terminal command.
python3 tickertapeexperiment.py
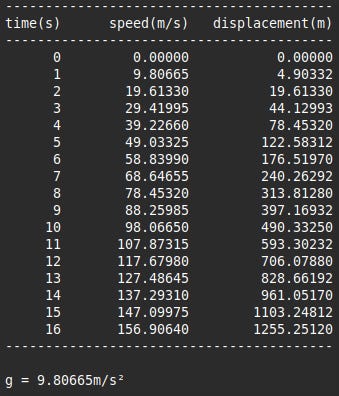
The terminal output looks like this, although as I mentioned earlier the actual speeds and displacements would lower due to air resistance and terminal velocity.
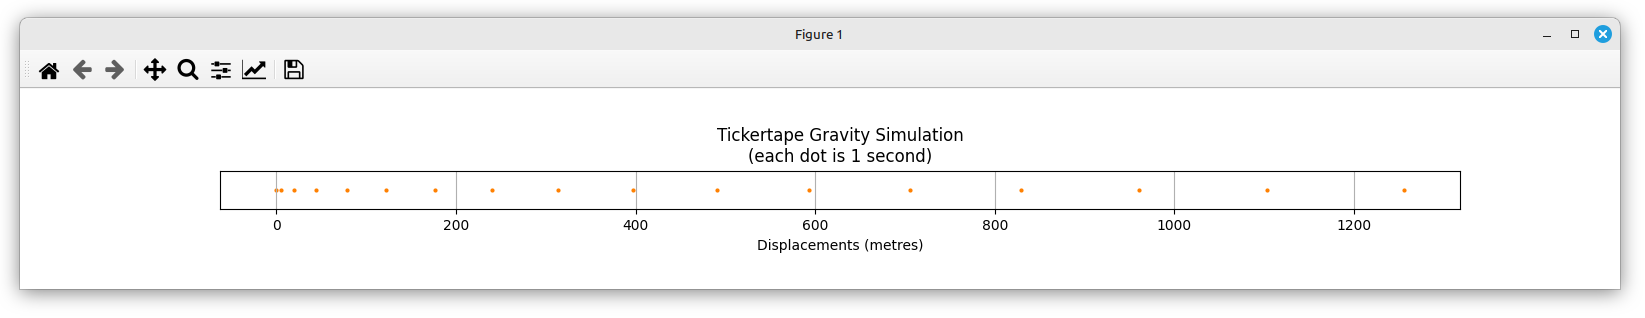
This is the representation of the tickertape created by Matplotlib.
No AI was used in the creation of the code, text or images in this article.