

Creating and Drawing an Ellipse in Python: Part 1


In very simplistic terms an ellipse is a squashed or stretched circle but a more formal definition is that of a conic section, i.e. the shape formed by slicing through a cone. There are a number of properties which precisely define an ellipse (by which I mean give all the information needed to draw one). For this project I will write a class which takes two numeric values, the semi-major axis and semi-minor axis, and uses them to calculate various other values. The diagram below illustrates the axes.
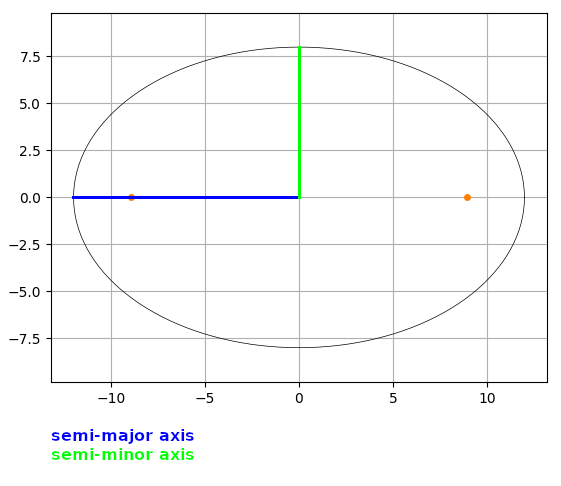
The semi-major and semi-minor axes are respectively the distances from the centre to the furthest and nearest points on the ellipse. There is an obvious comparison with the radius of a circle and these axes are sometimes known as the semi-major and semi-minor radii.
The orange dots are the foci or focal points of the ellipse, and their coordinates are some of the properties the code calculates. One of the characteristics of an ellipse is that the sum of the distances from the foci to any point of the ellipse is always the same.
Other values which we will be calculating are the area of the ellipse and a property known as the eccentricity, represented by the letter e. The latter specifies how "stretched out" the ellipse is, 0 being not at all (a circle), and getting arbritrarily close to 1 as the ellipse gets more stretched. The eccentricity of the ellipse above is 0.7453559924999299 (16dp). Our Ellipse class will also calculate a set of points or x,y coordinates which can be used to draw an ellipse.
I'll emphasise again that all the above values can be calculated from just the semi-major and semi-minor axes. However, it is also possible to calculate all the values from the semi-major axis and the eccentricity. Another useful thing to know is the perimeter of the ellipse or distance round it. So this code and article don't get too long I'll save these for Part 2.
The Project
This project consists of the following files:
ellipse.py - an Ellipse class to represent the features of an ellipse
ellipseplotter.py - plot an Ellipse object using Matplotlib
ellipsedemo.py - demonstrate usage of the code in the previous files
The files live in this GitHub repository.
The project uses the NumPy and Matplotlib libraries. If you are not familiar with these you might like to read my introductory articles on them.
The Code
This is ellipse.py.
import numpy as np
class Ellipse(object):
'''
Very simple class with properties for various
attributes of an ellipse.
The semi_major_axis and semi_minor_axis are init arguments,
the other values are calculated in init.
'''
def __init__(self, semi_major_axis:float=1.0, semi_minor_axis:float=1.0):
if semi_minor_axis > semi_major_axis:
raise ValueError("semi_minor_axis must be <= semi_major_axis")
# aka major & minor radii
self.semi_major_axis = semi_major_axis
self.semi_minor_axis = semi_minor_axis
# use a & b for brevity
self.a = self.semi_major_axis
self.b = self.semi_minor_axis
# linear eccentricity
self.c = (self.a**2 - self.b**2)**0.5
# calculate focal points
self.foci_1 = (self.c,0)
self.foci_2 = (-self.c,0)
# calculate area
self.area = np.pi * self.a * self.b
# calculate eccentricity
self.eccentricity = self.c / self.a
# number of points to calculate
# divide by higher number if larger plots
# have discernible straight lines
rad_interval = (2 * np.pi) / 144
# range of angles in radians equivalent to 360°
# for use as parameters in parametric equations
self.t = np.arange(0, np.pi * 2.01, rad_interval)
# pair of parametric equations to calculate points
self.x_coordinates = np.cos(self.t) * self.a
self.y_coordinates = np.sin(self.t) * self.b
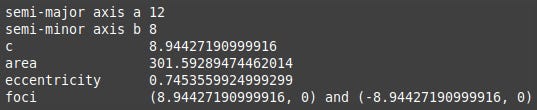
def __str__(self):
string = []
string.append(f"semi-major axis a {self.a}\n")
string.append(f"semi-minor axis b {self.b}\n")
string.append(f"c {self.c}\n")
string.append(f"area {self.area}\n")
string.append(f"eccentricity {self.eccentricity}\n")
string.append(f"foci {self.foci_1} and {self.foci_2}")
string = "".join(string)
return stringThe Ellipse class' __init__ firstly validates the semi_major_axis and semi_minor_axis arguments. By definition semi_major_axis is >= semi_minor_axis (if they are equal we have a circle which, yes, is a type of ellipse). If the values do not fulfil this criteron a ValueError is raised.
The rest of __init__ populates various properties, starting with semi_major_axis and semi_minor_axis straight from the arguments, which are duplicated as a and b, their conventional symbols, to make mathematical expressions more concise.
Next we calculate the linear eccentricity c (not to be confused with the plain eccentricity) which is the distance from the centre of the ellipse to the foci. This is then used to calculate the coordinates of the foci, the x-coordinates being + and - the linear eccentricity, and the y-coordinates are always 0.
The area has obvious parallels with the area of a circle πr2, although in this case the two radii are different so we can't use the squared shorthand.
The eccentricity is then calculated using c and a, which finishes off the properties of the ellipse itself.
The rest of the code creates a pair of NumPy arrays containing sets of x and y coordinates which can be used to plot the ellipse. This is done using parametric equations and if you'd like to know more about this topic take a look at my article Plotting Parametric Equations with Python . Very briefly, self.t is an array of angles in the radian equivalents of 0° to 360°. The coordinates themselves are calculated using these angles, the cos and sin functions, and the axes values a and b.
After all that comes a simple __str__ method which just assembles all the stuff calculated in __init__ into a human-friendly format.
The following code is ellipseplotter.py which uses Matplotlib to draw an ellipse represented by an Ellipse object.
import matplotlib.pyplot as plt
def plot(e):
'''
Plots the Ellipse object e and its foci
'''
plt.plot(e.x_coordinates,
e.y_coordinates,
linewidth=0.5,
color='#000000')
plt.plot(e.foci_1[0],
e.foci_1[1],
marker='o',
color='#FF8000',
markersize=4)
plt.plot(e.foci_2[0],
e.foci_2[1],
marker='o',
color='#FF8000',
markersize=4)
plt.grid(True)
plt.axis('equal')
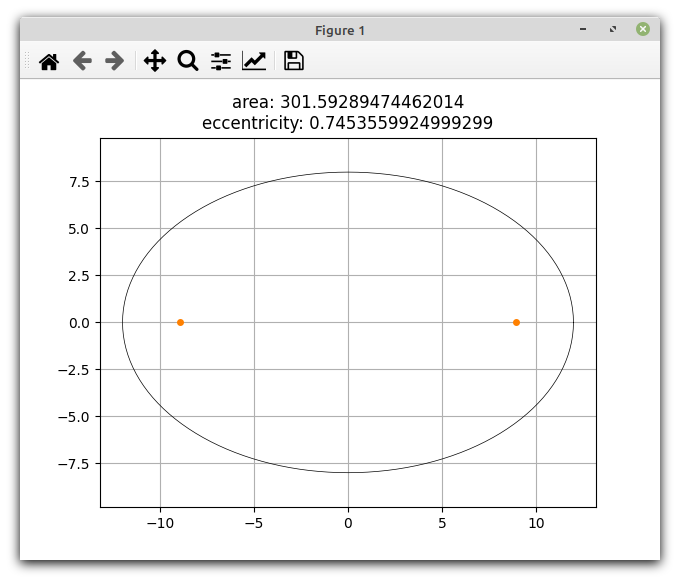
plt.title(f"area: {e.area}\neccentricity: {e.eccentricity}")
plt.show() Even if you have not used Matplotlib before this should be easy to follow. The coordinates of the ellipse itself and its foci have already been calculated in the Ellipse class so just need to be passed to Matplotlib's plot method with a few other arguments for aesthetic purposes. Note that it is necessary to call plt.axis('equal') to force Matplotlib to use the same scales for both axes, and I have set the title to show the area and eccentricity.
The final bit of code is ellipsedemo.py which creates an Ellipse object, prints its properties and passes it to ellipseplotter.plot to draw.
import ellipse
import ellipseplotter


def main():

    print("-----------------")
    print("| codedrome.com |")
    print("| Ellipses      |")
    print("-----------------\n")

    e = ellipse.Ellipse(12, 8)

    print(e)

    ellipseplotter.plot(e)


if __name__ == "__main__":

    main()
This is a very simple bit of code which creates an Ellipse (play around with the arguments if you wish), prints it and passes it to ellipseplotter.plot. Run the program like this.
python3 ellipsedemo.py
This is the end result.
As I mentioned earlier I have a Part 2 planned which will calculate the perimeter and also the various properties using the semi-major axis and the eccentricity.